\documentclass{beamer}

\usepackage{tikz}
\usepackage{graphicx}
\usetikzlibrary{decorations.text}

\begin{document}
\begin{frame}
  \frametitle{Donut and Pictures}
  \begin{figure}[h]
    \centering
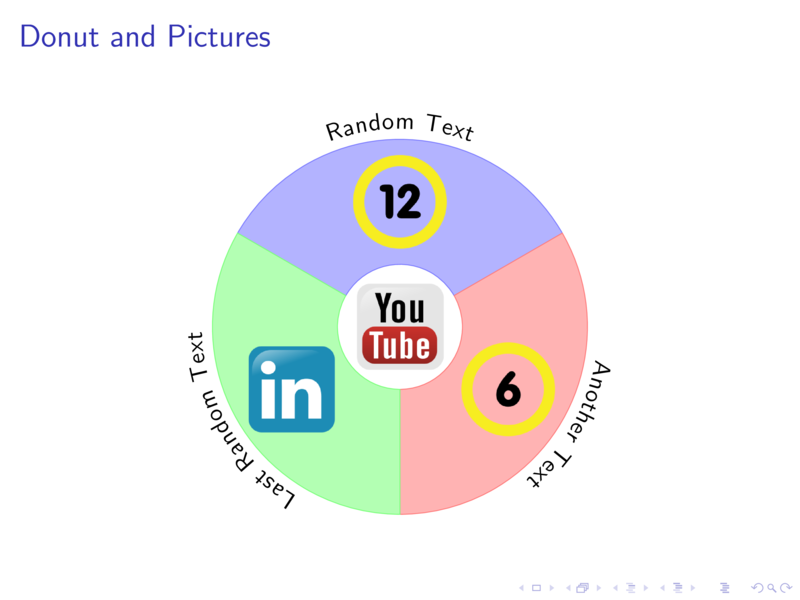
    \begin{tikzpicture}
      \newcommand*{\myInnerRadius}{1cm}%
      \newcommand*{\myOuterRadius}{3cm}%
      \newcommand*{\myMidRadius}{2cm}%

      % three segments in donut
      \filldraw[fill=blue!30, draw=blue!50] (30:\myInnerRadius) -- (30:\myOuterRadius) arc (30:150:\myOuterRadius) -- (150:\myInnerRadius) arc (150:30:\myInnerRadius);
      \filldraw[fill=red!30, draw=red!50] (30:\myInnerRadius) -- (30:\myOuterRadius) arc (30:-90:\myOuterRadius) -- (-90:\myInnerRadius) arc (-90:30:\myInnerRadius);
      \filldraw[fill=green!30, draw=green!50] (150:\myInnerRadius) -- (150:\myOuterRadius) arc (150:270:\myOuterRadius) -- (270:\myInnerRadius) arc (270:150:\myInnerRadius);

      % text around the donut
	    \path[decoration={text along path, text={Random Text}, text align={align=center}, raise=1ex}, decorate] (150:\myOuterRadius) arc (150:30:\myOuterRadius); 
  	  \path[decoration={text along path, text={Another Text}, text align={align=center}, raise=1ex}, decorate] (30:\myOuterRadius) arc (30:-90:\myOuterRadius); 
    	\path[decoration={text along path, text={Last Random Text}, text align={align=center}, raise=1ex}, decorate] (270:\myOuterRadius) arc (270:150:\myOuterRadius); 

      % image
      \node (G1) at (0:0cm) {\includegraphics[height=15mm]{Figs/youtube.png}};
      \node (G2) at (90:\myMidRadius) {\includegraphics[height=15mm]{Figs/12.png}};
      \node (G3) at (-30:\myMidRadius) {\includegraphics[height=15mm]{Figs/6.png}};
      \node (G4) at (210:\myMidRadius) {\includegraphics[height=15mm]{Figs/linkedin.png}};
    \end{tikzpicture}
  \end{figure}
\end{frame}
\end{document}
Comments Off on Donut and Pictures

doc

\documentclass{beamer}
 
\usepackage{tikz}
\usetikzlibrary{arrows}
\usetikzlibrary{calc}
 
\begin{document}
 
\begin{frame}{A New System}
\begin{figure}[h]
\centering
\begin{tikzpicture}%[node distance=16mm]
    \tikzstyle{box1} = [rectangle, thick, text centered ,
    minimum width=15mm, minimum height=14mm,
    top color=white, bottom color=blue!30, draw=blue!40]
 
    \tikzstyle{box2} = [rectangle, thick, text centered ,
    minimum width=15mm, minimum height=14mm,
    top color=white, bottom color=red!30, draw=red!40]
 
    \tikzstyle{box3} = [rectangle, thick, text centered ,
    text width=50mm, minimum height=14mm,
    top color=white, bottom color=green!30, draw=green!40]
 
    \tikzstyle{box4} = [rectangle, thick, text centered ,
    minimum width=15mm, minimum height=14mm,
    top color=white, bottom color=cyan!30, draw=cyan!40]

    \coordinate (P1) at (0cm, 0cm);
 
    \node [box1] (B1) at (P1) {Team1}; 
    \node [box2, anchor=west] (B2) at (B1.east) {Team2};
    \node [box3, anchor=west] (B3) at (B2.east) {\begin{tabular}{c} Team3 \\ in two lines\end{tabular}};
    \node [box4, anchor=west] (B4) at (B3.east) {Team4};

\end{tikzpicture}
\end{figure}
\end{frame}
\end{document}
Comments Off on PGF Drawing with anchor

Screen Shot 2016-06-14 at 1.05.51 AM

\documentclass{article}
% for graph drawing
\usepackage{tikz}
\usetikzlibrary{shapes}
\usetikzlibrary{circuits.ee.IEC}
% for two subfigures in one figure
\usepackage{subcaption}

\begin{document}
\begin{figure}[h]
	\centering
  \begin{subfigure}[b]{.48\textwidth}
	\centering
	\begin{tikzpicture}
		[
			circuit ee IEC,
			set resistor graphic=var resistor IEC graphic,
			small circuit symbols, semithick, 
			vertex/.style = {circle, draw=blue!40, fill=blue!10},
		]
		\coordinate (P4) at (0cm,  0mm);
		\coordinate (P1) at (150: 18mm);
		\coordinate (P2) at ( 30: 18mm);
		\coordinate (P3) at (270: 18mm);

		\node [vertex] (V1) at (P1) {1};
		\node [vertex] (V2) at (P2) {2};
		\node [vertex] (V3) at (P3) {3};
		\node [vertex] (V4) at (P4) {4};

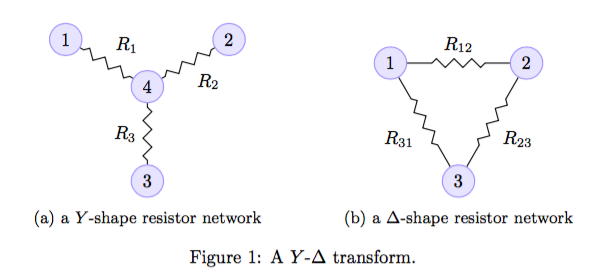
		\draw (V1) to [resistor={info={$R_{1}$}}] (V4);
		\draw (V2) to [resistor={info={$R_{2}$}}] (V4);
		\draw (V3) to [resistor={info={$R_{3}$}}] (V4);
	\end{tikzpicture}
	\caption{a $Y$-shape resistor network}
	\label{fig:y-shape}
	\end{subfigure}
	\begin{subfigure}[b]{.48\textwidth}
	\centering
	\begin{tikzpicture}
		[
			circuit ee IEC,
			set resistor graphic=var resistor IEC graphic,
			small circuit symbols, semithick, 
			vertex/.style = {circle, draw=blue!40, fill=blue!10},
		]
		\coordinate (P1) at (150: 15mm);
		\coordinate (P2) at ( 30: 15mm);
		\coordinate (P3) at (270: 15mm);

		\node [vertex] (V1) at (P1) {1};
		\node [vertex] (V2) at (P2) {2};
		\node [vertex] (V3) at (P3) {3};

		\draw (V1) to [resistor={info={$R_{12}$}}] (V2);
		\draw (V2) to [resistor={info={$R_{23}$}}] (V3);
		\draw (V3) to [resistor={info={$R_{31}$}}] (V1);
	\end{tikzpicture}
	\caption{a $\Delta$-shape resistor network}
	\label{fig:delta-shape}
	\end{subfigure}
	\caption{A $Y$-$\Delta$ transform.}
\end{figure}
\end{document}
Comments Off on Delta-Wye Transform

Screen Shot 2015-11-01 at 8.49.58 PM

\documentclass{beamer}

\usepackage{tikz}
\usetikzlibrary{arrows}
\usetikzlibrary{calc}

\begin{document}

\begin{frame}{A New System}
\begin{figure}[h]
\centering
\begin{tikzpicture}[node distance=0.7cm]
    \tikzstyle{box1} = [rectangle, thick, text centered ,
    text width=1.5cm, minimum height=.7cm,
    top color=white, bottom color=blue!30, draw=blue!40]

    \tikzstyle{box2} = [rectangle, thick, text centered ,
    text width=1.5cm, minimum height=.7cm,
    top color=white, bottom color=red!30, draw=red!40]

    \tikzstyle{box3} = [rectangle, thick, text centered ,
    text width=1.5cm, minimum height=.7cm,
    top color=white, bottom color=green!30, draw=green!40]

    \tikzstyle{box4} = [rectangle, thick, text centered ,
    text width=1.5cm, minimum height=.7cm,
    top color=white, bottom color=cyan!30, draw=cyan!40]

    \coordinate (A) at (-3cm, 0cm);
    \coordinate (B) at ( 0cm, 0cm);
    \coordinate (C) at ( 3cm, 0cm);

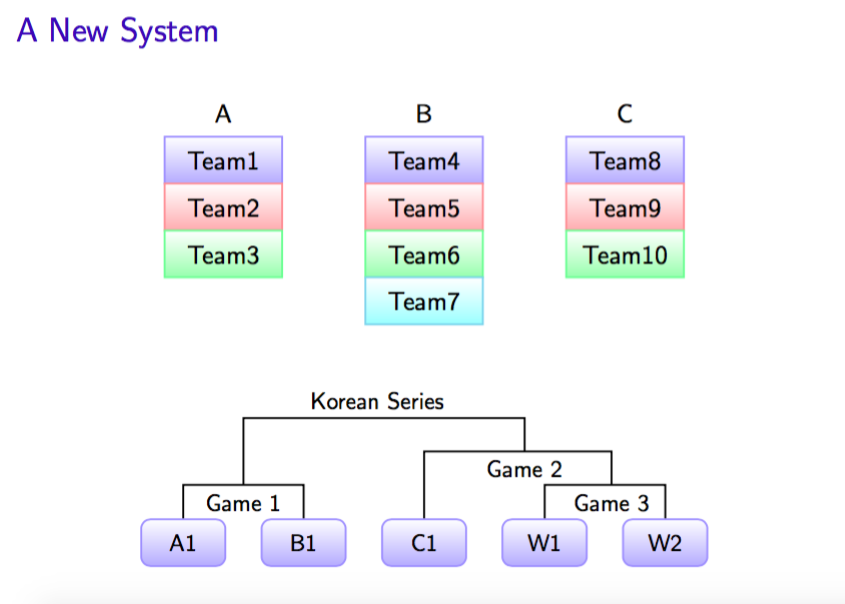
    \node [box1] (A1) at (A) {Team1}; 
    \node [box1] (B1) at (B) {Team4};
    \node [box1] (C1) at (C) {Team8};

    \node [box2] (A2) [below of=A1] {Team2};
    \node [box2] (B2) [below of=B1] {Team5};
    \node [box2] (C2) [below of=C1] {Team9};

    \node [box3] (A3) [below of=A2] {Team3};
    \node [box3] (B3) [below of=B2] {Team6};
    \node [box3] (C3) [below of=C2] {Team10};

    \node [box4] (B4) [below of=B3] {Team7};
    
    \node [above of=A1] {A};
    \node [above of=B1] {B};
    \node [above of=C1] {C};
\end{tikzpicture}
\end{figure}

\begin{figure}
\begin{tikzpicture}[node distance=1.8cm]
    \tikzstyle{box1} = [rectangle, thick, text centered ,
    text width=1cm, minimum height=.7cm, rounded corners,
    top color=white, bottom color=blue!30, draw=blue!40]

    \tikzstyle{line} = [thick, draw=black]

    \coordinate (O) at (0cm, 0cm);

    \node [box1] (A1) at (O) {\small A1};
    \node [box1] (B1) [right of=A1] {\small B1};
    \node [box1] (C1) [right of=B1] {\small C1};
    \node [box1] (W1) [right of=C1] {\small W1};
    \node [box1] (W2) [right of=W1] {\small W2};

    \path [line] (A1.north) |- ++(18mm, 5mm) coordinate [pos=.75] (m-1-2) -| (B1.north);

    \path [line] (W1.north) |- ++(10mm, 5mm) coordinate (m-4-5) -| (W2.north);

    \path [line] (C1.north) |- ++(15mm, 10mm) coordinate (m-3-4) -| (m-4-5);

    \path [line] (m-1-2) |- ++(20mm, 10mm) coordinate (m-final) -| (m-3-4);

    \node [below] at (m-1-2) {\small Game 1};
    \node [below] at (m-3-4) {\small Game 2};
    \node [below] at (m-4-5) {\small Game 3};
    \node [above] at (m-final) {\small Korean Series};
\end{tikzpicture}
\end{figure}
\end{frame}
\end{document}
Comments Off on Baseball Elimination Figure

\documentclass[letterpaper,11pt]{article}

\usepackage[papersize={85mm, 55mm}, text={75mm, 45mm}]{geometry}
\pagestyle{empty}

% For automata drawings
\usepackage{tikz}
\usepackage{pgf}
\usetikzlibrary{arrows}

\begin{document}
\begin{figure}[h]
  \footnotesize
  \centering
  \begin{tikzpicture}[
    % type of arrow head
    >=stealth',
    % keep arrow head from touching the surface
    shorten >= 1pt,
    % automatic node positioning
    auto,
    % 
    node distance=2cm,
    % line thickness
    semithick,
    bend angle=10,
    graybox/.style = {draw=gray!20, fill=gray!20, rounded corners},
    line/.style = {->, draw=black, thick},
    box/.style = {circle, draw=blue!50, fill=blue!20, minimum size=4mm}
    ]

    \coordinate (S) at (-5cm, 0cm);

    \coordinate (S1) at (-3cm, 2cm);
    \coordinate (S2) at (-3cm, 1cm);
    \coordinate (S3) at (-3cm, 0cm);
    \coordinate (S4) at (-3cm, -2cm);

    \coordinate (M1) at (0cm, 1.5cm);
    \coordinate (M2) at (0cm,  .5cm);
    \coordinate (M3) at (0cm,-1.5cm);

    \coordinate (T) at (2cm, 0cm);

    \node (BBox) [graybox, minimum width=1cm, minimum height=2cm] at (-3cm, 1.5cm) {};
    \node [left] at (BBox.130) {$S_1$};

     % nodes
    \node (Sbox)  [box] at (S)  {s};
    \node (Sbox1) [box] at (S1) {$\ell_1$};
    \node (Sbox2) [box] at (S2) {$\ell_2$};
    \node (Sbox3) [box] at (S3) {$\ell_3$};
    \node (Sbox4) [box] at (S4) {$\ell_n$};
    
    \node (Mbox1) [box] at (M1) {$r_1$};
    \node (Mbox2) [box] at (M2) {$r_2$};
    \node (Mbox3) [box] at (M3) {$r_m$};
    
    \node (Tbox) [box] at (T) {t};
    
    \fill [black] (-3cm,  -.8cm) circle (1.2pt);
    \fill [black] (-3cm,   -1cm) circle (1.2pt);
    \fill [black] (-3cm, -1.2cm) circle (1.2pt);

    \fill [black] (0cm, -.3cm) circle (1.2pt);
    \fill [black] (0cm, -.5cm) circle (1.2pt);
    \fill [black] (0cm, -.7cm) circle (1.2pt);


    % edges
    \path[line] (Sbox) -- node [above] {1} (Sbox1);
    \path[line] (Sbox) -- node [above] {1} (Sbox2);
    \path[line] (Sbox) -- node [below] {1} (Sbox3);
    \path[line] (Sbox) -- node [below] {1} (Sbox4);

    \path[line] (Sbox1) -- node [above] {1} (Mbox1);
    \path[line] (Sbox2) -- node [above] {1} (Mbox1);

    \path[line] (Sbox3) -- node [above, pos=.7] {1} (Mbox2);

    \path[line] (Sbox1) -- node [below, pos=.3] {1} (Mbox3);

    \path[line] (Sbox4) -- node [below] {1} (Mbox2);
    \path[line] (Sbox4) -- node [below] {1} (Mbox3);

    \path[line] (Mbox1) -- node [above] {$d_1$} (Tbox);
    \path[line] (Mbox2) -- node [below] {$d_2$} (Tbox);
    \path[line] (Mbox3) -- node [below] {$d_m$} (Tbox);
   \end{tikzpicture}
 \end{figure}
\end{document}
Comments Off on Flow Network Example